Steven Morse personal website and research notes
Using ESPN's new Fantasy API (v3)
Written on July 27th, 2019 by Steven MorseESPN has a weirdly undocumented API for interacting with their fantasy sports platforms. People had figured it out though: there were various libraries, reddit discussions, and blog posts about how to use it to augment your fantasy league season with a little frivolous data science.
Then ESPN changed the API earlier this year (2019) and everyone’s code broke. (I wrote three blog posts on the old version and most of it’s now unusable. Sad.)
But around the interwebs people are figuring out the new “version 3” API. Here’s a JS API Client and a Python project.
This post is a crash course in what I know about it, enough to hopefully get your feet wet before the 2019 fantasy season crashes in. In a follow-up post, I show how to grab historical player projections and compare to reality. In this post I compare actual to optimal rosters along with ESPN projections.
(I’ll work in Python, but you could do everything in your environment/language of choice — the hard part is figuring out how to access the data. )
Teaser
The API enables grabbing historical player projections, doing your own forecasts, automating player moves, in-season analysis of teams… But let’s start simple with simple game scores.
Since you can do nothing to affect your opponent’s score in a typical fantasy format, there is typically lots of whining that “I had the second highest score this week but got matched up to the highest scorer!”
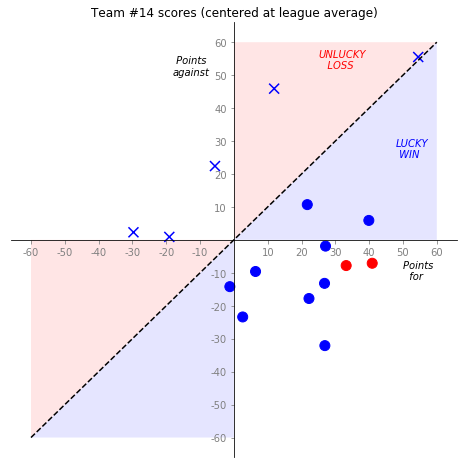
To quantify this: take some team, plot all their games, with their score as the x-axis and their opponent’s score as the y-axis, but scaled to be relative to the league average. So your “points for” is a positive number if you outperformed the league average, negative if you underperformed, and same for your opponent.
Here’s the plot:
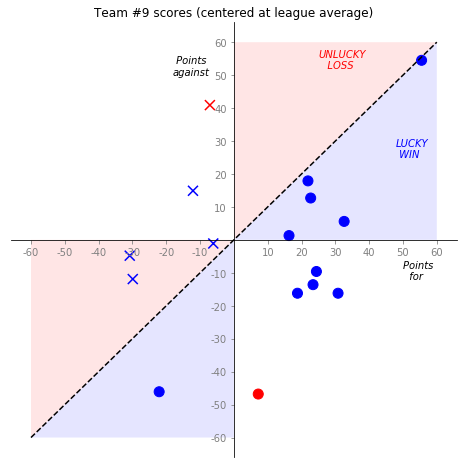
Circles are wins, X’s are losses, blue is regular season, red is playoffs. Those “unlucky losses” — when you would have beat the league average team that week, but instead you got matched up against someone else who also outperformed, and lost — are the red regions. Similarly, “lucky wins” — i.e. you under/overperformed, and so did your opponent, but you squeaked a win out anyway — are the blue regions.
Kinda cool. So how do we grab this data? Manual entry of scores? Boooo. We can use ESPN’s API and automate this, and also get access to a much deeper well of information.
The basics
The new v3 API has two base URLs. For the current season, which as of this post appears to still include 2018, use
https://fantasy.espn.com/apis/v3/games/ffl/seasons/<YEAR>/segments/0/leagues/<ID>
where <ID> is the league ID.
For any historical season, use
https://fantasy.espn.com/apis/v3/games/ffl/leagueHistory/<ID>?seasonId=<YEAR>
where <YEAR> is anything 2017 or previous (not sure how far back it goes, but I was finding what appeared to be correct info for one of my leagues’ 2013 season).
You can put this URL in a browser and look at the resulting text (at this point it will show only some basic info about the league members), formatted in JSON, which will look very familiar to a Python programmer since the structures are similar to Python’s, more on that in a bit.
Anyway let’s do this request via Python, for example:
import requests

league_id = 123456
year = 2013
url = "https://fantasy.espn.com/apis/v3/games/ffl/leagueHistory/" + \
      str(league_id) + "?seasonId=" + str(year)

r = requests.get(url)
d = r.json()[0]
Note:. For some reason, the “current” URL returns a JSON, but the “historical” URL returns a JSON in a list of length one, thus the weird [0].
The r.json() command, in essence, translates the long, nasty JSON text into a nested data structure of Python data types. We’ll start digging around in it further on.
Sidenote: Dealing with private leagues
(Summarized from here.) A private league is slightly annoying for GET requests because now we somehow need to “login” through the request. One way to do this is to send session cookies along with the request. (To my knowledge there is nothing against ESPN’s ToS about using your own cookies for personal use within your own league.)
Specifically, we can modify our GET request from before to:
r = requests.get(url,
                 cookies={"swid": "{SWID-COOKIE-HERE}",
                          "espn_s2": "LONG_ESPN_S2_COOKIE_HERE"})
I saw that the SWID and the ESPN_S2 cookies were the magic tickets based on the similar coding endeavors here and here and here.
You can find these cookies in Safari by opening the Storage tab of Developer tools (you can turn on developer tools in Preferences), and look under espn.com in the Cookies folder. In Chrome, you can go to Preferences -> Advanced -> Content Settings -> Cookies -> See all cookies and site data, and look for ESPN.
Checking out mMatchup
So far our API query only returns basic info about the league members. Boring.
To get richer information, we need to request specific “views” on the data. In this post we’ll just cover one: weekly scores with the mMatchup view.
The URL we’re interested in looks like this:
https://fantasy.espn.com/apis/v3/games/ffl/
 leagueHistory/<ID>?seasonId=<YEAR>?view=mMatchup
All the stuff after ?’s are parameters to the request, so requests allows us to make this call like this:
r = requests.get(url, params={"view": "mMatchup"})
(and yes, you could send the season ID this way too, instead of in the URL.) If you needed to send session cookies you could of course include that as well.
It’s worth taking a moment to poke around the structure of the resulting JSON.
{'teams': [ ... ],
 'schedule': [
   {'away': {'gamesPlayed': 0,
    ... }},
   ...
 ]}
Note we get matchup outcomes AND roster info with this request. Let’s focus on the matchup scores and plot some low-hanging fruit.
Win/loss margins
First we’ll put the scores in an easier to use format: a pandas.DataFrame is really helpful here:
df = [[
        game['matchupPeriodId'],
        game['home']['teamId'], game['home']['totalPoints'],
        game['away']['teamId'], game['away']['totalPoints']
    ] for game in d['schedule']]
df = pd.DataFrame(df, columns=['Week', 'Team1', 'Score1', 'Team2', 'Score2'])
df['Type'] = ['Regular' if w<=14 else 'Playoff' for w in df['Week']]
df.head()
    Week    Team1   Score1  Team2   Score2  Type
0   1   5   84.0    12  91.0    Regular
1   1   13  123.0   1   109.0   Regular
2   1   15  130.0   9   140.0   Regular
3   1   2   128.0   14  139.0   Regular
4   1   3   98.0    4   131.0   Regular
Now we can create a list of each team’s margin of victory/defeat for each game:
df3 = df.assign(Margin1 = df['Score1'] - df['Score2'],
                Margin2 = df['Score2'] - df['Score1'])
df3 = (df3[['Week', 'Team1', 'Margin1', 'Type']]
 .rename(columns={'Team1': 'Team', 'Margin1': 'Margin'})
 .append(df3[['Week', 'Team2', 'Margin2', 'Type']]
 .rename(columns={'Team2': 'Team', 'Margin2': 'Margin'}))
)
df3.head()
    Week    Team    Margin  Type
0   1   5   -7.0    Regular
1   1   13  14.0    Regular
2   1   15  -10.0   Regular
3   1   2   -11.0   Regular
4   1   3   -33.0   Regular
(I think there’s a way to do that last maneuver with pd.wide_to_long but I couldn’t figure it out.) Now, plot it …
fig, ax = plt.subplots(1,1, figsize=(16,6))
order = [14, 13, 9, 1, 15, 12, 3, 4, 2, 5]
sns.boxplot(x='Team', y='Margin', hue='Type',
            data=df3,
            palette='muted',
            order=order)
ax.axhline(0, ls='--')
ax.set_xlabel('')
ax.set_title('Win/Loss margins')
plt.show()
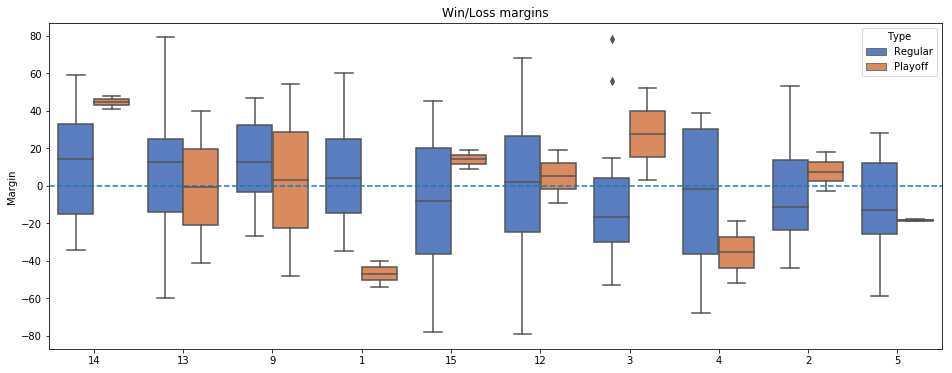
This is ordered by final standing. You can see the playoff teams all had strong regular season performance, although more variance than I expected.
Lucky!
For the “teaser” idea at the beginning of the blog, we need the league average score for each week:
# get average score per week
avgs = (df
 .filter(['Week', 'Score1', 'Score2'])
 .melt(id_vars=['Week'], value_name='Score')
 .groupby('Week')
 .mean()
 .reset_index()
)
avgs.head()
    Week    Score
0   1   117.3
1   2   103.1
2   3   116.2
3   4   116.1
4   5   113.6
and then we can pick a team and compute the points for/against centered by the league average:
tm = 9

# grab all games with this team
df2 = df.query('Team1 == @tm | Team2 == @tm').reset_index(drop=True)

# move the team of interest to "Team1" column
ix = list(df2['Team2'] == tm)
df2.loc[ix, ['Team1','Score1','Team2','Score2']] = \
    df2.loc[ix, ['Team2','Score2','Team1','Score1']].values

# add new score and win cols
df2 = (df2
 .assign(Chg1 = df2['Score1'] - avgs['Score'],
         Chg2 = df2['Score2'] - avgs['Score'],
         Win  = df2['Score1'] > df2['Score2'])
)
… and then plot it (awful code omitted). Here’s a season champ:
Next up
Some other views to explore are (non-exhaustive list):
mTeammBoxscoremRostermSettingskona_player_infoplayer_wlmSchedule
and we have various params to try along with these like matchupPeriodId, forTeamId, … A difficulty I’ve noticed is requesting two views produces a different set of information than just concatenating the two views independently.
I suggest checking out the various projects and reddit discussions on this topic for more clues.
Another strategy: ESPN uses this API to populate the site when you are poking around your league, so you can eavesdrop on these calls to get hints of what to explore. For example, using Safari’s “Timelines” Web Developer tool, or a proxy service like Charles or Fiddler.
Next post: grab historical player projections, and compare to reality.
Written on July 27th, 2019 by Steven Morse