Steven Morse personal website and research notes
Using the NYT Crossword and Games API
Written on December 23rd , 2024 by Steven MorseI have been doing the NY Times crossword since I was a kid, and now their games have expanded and gotten so popular, I thought I’d take a look at whatever API they’re using. Most of the resources online focus on the crossword — I’ll cover that, but also take a look at the APIs for Connections and Spelling Bee and Wordle, since my family is into those. I’ll use Python to play around with the data.
Before we start, if you’re also a non-expert crossworder like me, and occasionally get stuck but don’t want to look up answers, check out this project I started recently: Crossword Buddy gives you alternative clues to help you think about the clues differently and solve without looking up answers.
Okay and props to inspiration from work on the API stuff in this and this Github repos, discussion here, and this fun set of visualizations for the Mini at Observable here. And of course if you’re interested in better crossword stats, check out XWStats.com.
Crosswords API (Basics)
The Crossword API base URL is https://www.nytimes.com/svc/crosswords/. From there we have:
v6/puzzle/daily/yyyy-mm-dd.jsonfor full puzzle info for date (e.g.2024-12-25). This has metadata like constructors and editors, and the by-cell letter and clue data.v3/puzzles.jsonhas metadata for the crossword and Mini, for a large range you can specify with additional params in the request payload.v6/game/{id}.jsonhas user-specific stats for the puzzle with ID{id}, for whatever user cookie is passed in the request headers.
So for example, you could enter one of these URLs in your browser and (assuming your NYT credentials/cookie is stored) it will load a JSON you could poke around in.
To do a successful GET or POST to any of these endpoints not in the browser, we need to send those credentials manually. Fortunately, all we need to send is our NYT-S cookie. You can find this cookie a variety of ways: the most illuminating way is to open Web Developer tools in your browser on the NYT Crossword page and click on the “Network” tab (or equivalent for your browser), then look for a call to one of these endpoints, open it, and examine the headers (and response, while you’re at it).
You’ll see a dozen or so cookies listed in the form:
{cookie-name}="{cookie-value}";
And we only need the one with name NYT-S. Note this is your personal session cookie, it lasts about 6 months to a year, and it would of course be highly insecure to give this to someone else, or post it online, etc., because someone could use it to spoof your account.
Once you have this cookie, you can replicate a call to the API with, for example, a cURL call from the command line:
$ curl --cookie "NYT-S=your-long-cookie" https://www.nytimes.com/svc/crosswords/v6/puzzle/daily/2024-12-24.json
Or, if we’re going to be doing much experimentation, it might be better to do this in a script, like in Python:
import requests

date_str = '2024-12-24'
url = f'https://www.nytimes.com/svc/crosswords/v6/puzzle/daily/{date_str}.json'
nyt_s = '{your-long-NYT-S-cookie}'

response = requests.get(url, headers={'Cookie': f'NYT-S={nyt_s};'})

if response.status_code == 200:
    data = response.json()
else:
    print(f'Failed to retrieve data: {response.status_code}')
And now you can start poking around: check data.keys(), etc.
Plotting a solve
Let’s say we want to plot our solve journey for the December 22 (Sunday) puzzle. First we should grab the ID for our puzzle:
url = f'https://www.nytimes.com/svc/crosswords/v3/puzzles.json'

payload = {
    "publish_type": "daily",
    "date_start": "2024-12-22",
    "date_end": "2024-12-22",
}

response = requests.get(url, params=payload, headers={'Cookie': f'NYT-S={nyt_s};'})
response.json()['results']
[{'author': 'Adrian Johnson',
  'editor': 'Joel Fagliano',
  'format_type': 'Normal',
  'print_date': '2024-12-22',
  'publish_type': 'Daily',
  'puzzle_id': 22433,
  'title': 'Go With the Flow',
  'version': 0,
  'percent_filled': 100,
  'solved': True,
  'star': 'Gold'}]
So the id is 22433. Now use this to get our detailed stats:
import numpy as np      # using NumPy for convenience for sorting
import matplotlib.pyplot as plot

id = 22433
url = f'https://www.nytimes.com/svc/crosswords/v6/game/{id}.json'
response = requests.get(url, headers={'Cookie': cookies_str})
data = response.json()
We can check our solve time with data['calcs'] which has a secondsSpentSolving field. For this puzzle, I clocked in at 1240 seconds = 20.66 minutes. We also note the data['lastSolve'] and data['minGuessTime'] give us our starting and ending raw timestamps, in my case yielding a total time of 2603 second = 43.38 minutes. This means I spent about 23 minutes with the game paused doing other things.
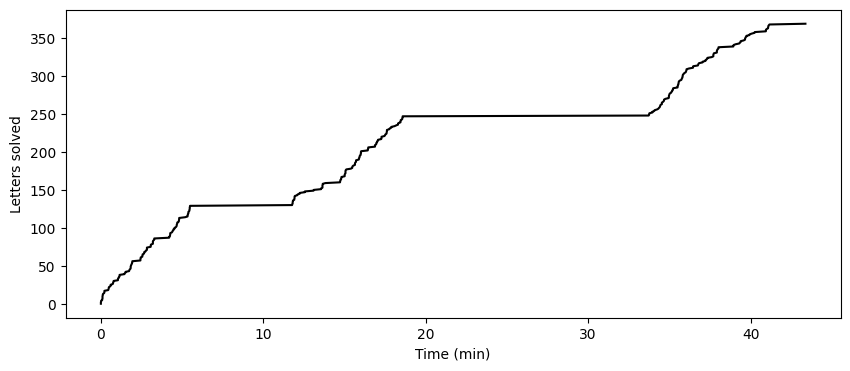
In data['board'] we have the timestamps for each letter solved, but unfortunately it doesn’t offer any way to account for pauses, so we see the following:
# this plucks out the timestamps for each letter getting solved and sorts them
timestamps = np.array(
    [item['timestamp'] for item in data['board']['cells'] if len(item) > 1])
timestamps.sort()

fig, ax = plt.subplots(1,1, figsize=(10,4))
ax.plot(timestamps / 60, np.arange(timestamps.shape[0]), 'k-')

ax.set_ylabel('Letters solved')
ax.set_xlabel('Time (min)')

plt.show()

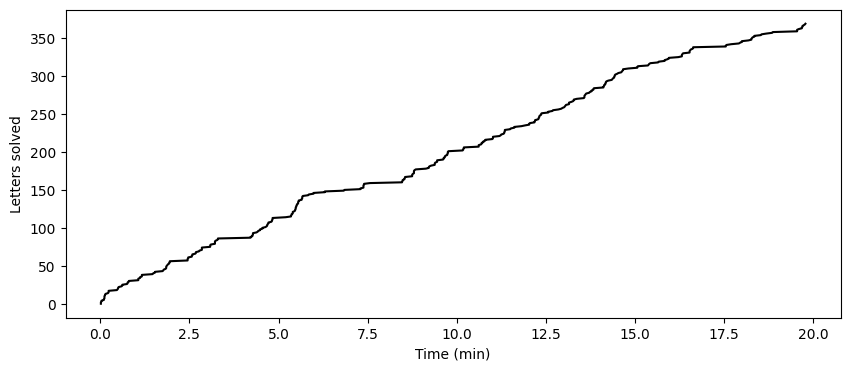
Note this is raw timestamps, not “in game” timestamps, so you can see big periods of inactivity. I don’t see “pause” timestamps anywhere so we’ll just do a hacky solution and adjust out any gaps longer than 2 minutes:
timestamps = np.array([item['timestamp'] for item in data['board']['cells'] if len(item) > 1])
timestamps.sort()

# Calculate the differences between consecutive timestamps
diffs = np.diff(timestamps)

# Identify the indices where the gap is greater than 120 seconds
gap_idx = np.where(diffs > 120)[0]

# Create a new array with gaps removed
new_timestamps = timestamps.copy()
for ix in gap_idx:
    new_timestamps[ix+1:] -= diffs[ix] - 1


fig, ax = plt.subplots(1,1, figsize=(10,4))
ax.plot(new_timestamps / 60, np.arange(new_timestamps.shape[0]), 'k-')

ax.set_ylabel('Letters solved')
ax.set_xlabel('Time (min)')

plt.show()

This is better, although now we’re undercutting a little bit which implies I stared at the grid for at least 2 minutes a couple times, lol.
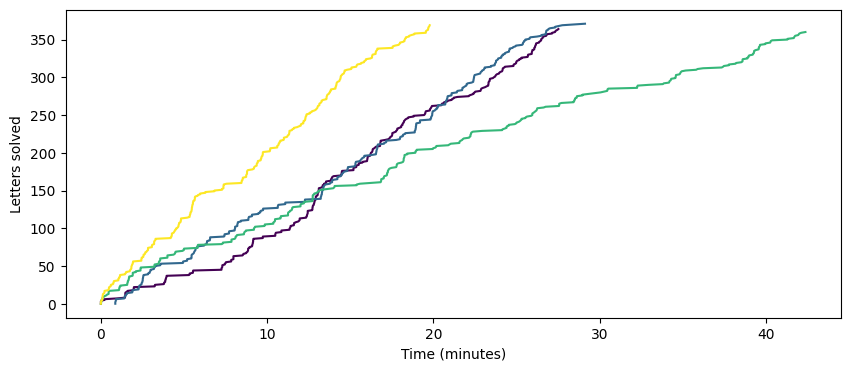
Anyway, let’s grab a few of these and plot a Sunday journey summary for a month period.
# Start and end dates
start_date = datetime(2024, 12, 1)
end_date = datetime(2024, 12, 23)

# Find the first Sunday on or after the start date
current_date = start_date
while current_date.weekday() != 6:  # 6 corresponds to Sunday
    current_date += timedelta(days=1)

# Generate all Sundays between start_date and end_date
sundays = []
while current_date <= end_date:
    sundays.append(current_date.strftime('%Y-%m-%d'))
    current_date += timedelta(days=7)

# get all puzzles in this range
payload = {
    "publish_type": "daily",
    "sort_order": "asc",
    "sort_by": "print_date",
}

data = requests.get('https://www.nytimes.com/svc/crosswords/v3/puzzles.json',
                    params=payload, headers={'Cookie': cookies_str})
data = data.json()

puzzle_ids = []
for puzzle in data['results']:
    if puzzle['print_date'] in sundays:
        puzzle_ids.append(puzzle['puzzle_id'])

fig, ax = plt.subplots(1,1, figsize=(10,4))

# Get colors for each id in puzzle_ids using viridis colormap
cmap = plt.get_cmap('viridis')
colors = cmap(np.linspace(0, 1, len(puzzle_ids)))

for k, id in enumerate(puzzle_ids):

    data = requests.get(f'https://www.nytimes.com/svc/crosswords/v6/game/{id}.json',
                        headers={'Cookie': cookies_str})
    data = data.json()
    # print(id, data.keys())

    try:
        timestamps = np.array([item['timestamp'] for item in data['board']['cells'] if len(item) > 1])
    except:
        continue

    timestamps.sort()

    # Calculate the differences between consecutive timestamps
    diffs = np.diff(timestamps)

    # Identify the indices where the gap is greater than 120 seconds
    gap_idx = np.where(diffs > 120)[0]

    # Create a new array with gaps removed
    new_timestamps = timestamps.copy()
    for ix in gap_idx:
        new_timestamps[ix+1:] -= diffs[ix] - 1

    ax.plot(new_timestamps / 60, np.arange(new_timestamps.shape[0]), color=colors[k])

ax.set_xlabel('Time (minutes)')
ax.set_ylabel('Letters solved')
plt.show()

Other APIs: Connections, Spelling Bee, …
We can apply a similar pattern (scope out the API call with Web Developer tools, send NYT-S cookie, poke around with a language like Python) to the other NYT Games.
-
https://www.nytimes.com/svc/connections/v2/yyyy-mm-dd.jsonfor Connections, and you get the categories, puzzle id, solve status. -
https://www.nytimes.com/svc/wordle/v2/yyyy-mm-dd.jsonfor Wordle, for the solution, puzzle id. -
For Wordle and Spelling Bee, there is another endpoint
https://www.nytimes.com/svc/games/statewhich has user stats (longest word, rank counts, etc). -
Spelling Bee data is directly encoded in the webpage and I don’t see any API requests grabbing it, so I’m not sure how to get historical puzzle data.
That’s it for now, hope this has been helpful/interesting, it certainly was for me. Happy puzzling
Written on December 23rd , 2024 by Steven Morse