Steven Morse personal website and research notes
Exploring the Spotify API in Python
Written on May 1st , 2020 by Steven MorseSpotify has a very developer-friendly API one can use to stream their services via apps, websites, and other very serious ventures — or you can just tinker around with their massive music database and find out how “danceable” your 2020 playlist was.
Most tutorials on this for Python rely on the awesome spotipy package. But I prefer to bake my own janky cake before I try other people’s production-level code. And there’s a bit less out there for Python-sans-spotipy, so I thought I’d share a get-started guide here.
This blog is in three parts: first we get registered as a Spotify Developer and use our client credentials to get an access token; second we do some very basic exploration of things like album listing or track properties; third we combine all this into some more interesting analysis.
Getting access
Getting client credentials
Whether you’re using spotipy or rolling your own, first you need to get client credentials to the Spotify API.
Assuming you already have a Spotify account (free or paid), head over to Spotify for Developers and open your Dashboard. Click on “Create a Client ID” and work your way through the checkboxes.
This is designed for developing actual mobile apps and streaming services, and we are just doing some hobbyist tinkering, so there may be some confusing choices, but just pick something.
Click on the new project and you should see a “Client ID” and “Client Secret” on the left-hand side. These numbers are the only important part of this page, for us. At this point, you could use these to start working in spotipy or other pre-fab libraries out there (here’s one for R called spotifyr, of course). Or, like Stevie Nicks, you can Go Your Own Way. Read on:
Getting an access token
Now let’s open up our Python environment of choice. Right now we just need to send some GET and POST requests, so let’s use the requests library, and save those client credentials from our Spotify project’s page:
import requests

CLIENT_ID = 'yourclientid'
CLIENT_SECRET = 'yourclientsecret'
In order to access the various endpoints of the Spotify API, we need to pass an access token. There’s docs on Spotify for this, or user tutorials — but essentially we just need to POST a request with our client credentials and save the appropriate part of the response:
AUTH_URL = 'https://accounts.spotify.com/api/token'

# POST
auth_response = requests.post(AUTH_URL, {
    'grant_type': 'client_credentials',
    'client_id': CLIENT_ID,
    'client_secret': CLIENT_SECRET,
})

# convert the response to JSON
auth_response_data = auth_response.json()

# save the access token
access_token = auth_response_data['access_token']
The access token itself is just a long alphanumeric string, like the client credentials. This is our golden ticket to access the API.
Poking around
There are a million endpoints to access things like album listings, artist information, playlists, even Spotify-generated audio analysis of individual tracks like their key, time signature, or “danceability.”
In order to access them, we send a properly formed GET request to the API server, with our access_token in the header. Let’s save this header info now, in the following very specific format:
headers = {
    'Authorization': 'Bearer {token}'.format(token=access_token)
}
Let’s start with checking out the audio features for a specific track, using the audio-features endpoint.
We’ll need the Track ID, which you can get by going to Spotify, clicking the “…” by a track, then “Share”, then “Copy Spotify URI”. On your clipboard is now something like: spotify:track:6y0igZArWVi6Iz0rj35c1Y. The ending is the Track ID, which is all we need:
# base URL of all Spotify API endpoints
BASE_URL = 'https://api.spotify.com/v1/'

# Track ID from the URI
track_id = '6y0igZArWVi6Iz0rj35c1Y'

# actual GET request with proper header
r = requests.get(BASE_URL + 'audio-features/' + track_id, headers=headers)
Now we can convert this response to JSON and take a peek around:
r = r.json()
r
{'acousticness': 0.446,
 'analysis_url': 'https://api.spotify.com/v1/audio-analysis/6y0igZArWVi6Iz0rj35c1Y',
 'danceability': 0.54,
 'duration_ms': 234910,
 'energy': 0.59,
 'id': '6y0igZArWVi6Iz0rj35c1Y',
 'instrumentalness': 0,
 'key': 0,
 'liveness': 0.14,
 'loudness': -4.359,
 'mode': 1,
 'speechiness': 0.0528,
 'tempo': 119.878,
 'time_signature': 4,
 'track_href': 'https://api.spotify.com/v1/tracks/6y0igZArWVi6Iz0rj35c1Y',
 'type': 'audio_features',
 'uri': 'spotify:track:6y0igZArWVi6Iz0rj35c1Y',
 'valence': 0.267}
Cool. And even cooler: the Spotify API docs give detailed explanations of the meanings of each of these values.
(Technical sidenote: earlier we did a POST request, which carried our credential information in the message body and is fairly secure. Now we’re doing a GET request, which carries the request in the URL itself, and is therefore less secure but fine for data requests like this.)
With a growing sense of the power we now wield, let’s expand our exploration.
Putting it together
Getting the data
Let’s now pick an artist, grab all their albums, all the tracks from each album, and store the audio features and analysis of each one in a big dataframe, then see what sort of interesting things we find.
(BTW, this also spares us grabbing tons of URIs by hand. No need for that, and anyway there are huge annotated lists of these, for example on Kaggle.)
I’m going to do Led Zeppelin because they have a big, varied discography which should be fun to explore (and because I’m just a huge fan). Their URI (grab it the same as for a track) is spotify:artist:36QJpDe2go2KgaRleHCDTp and the endpoint for pulling albums is artists/{id}/albums, so we do
artist_id = '36QJpDe2go2KgaRleHCDTp'

# pull all artists albums
r = requests.get(BASE_URL + 'artists/' + artist_id + '/albums',
                 headers=headers,
                 params={'include_groups': 'album', 'limit': 50})
d = r.json()
Don’t forget the headers and note I’ve added a set of params to tell Spotify I only want full albums (no singles, appears-on, etc) and to give me everything (max is 50).
The jewel of this JSON is the list of albums in items, so e.g. d['items'][0] is a JSON of the first album in the list. We can take a look at all the albums we grabbed and their release dates:
for album in d['items']:
    print(album['name'], ' --- ', album['release_date'])
The Complete BBC Sessions  ---  2016-09-16
Physical Graffiti (Deluxe Edition)  ---  2015-02-20
Celebration Day  ---  2012-11-19
Mothership  ---  2007
How the West Was Won (2018 Remaster)  ---  2003-05-27

...

Led Zeppelin II  ---  1969-10-22
Led Zeppelin (Deluxe Edition)  ---  1969-01-12
Led Zeppelin (Deluxe Edition)  ---  1969-01-12
Led Zeppelin (Remastered)  ---  1969-01-12
Led Zeppelin  ---  1969-01-12
There’s nearly 40, and lots of “duplicates”, not to mention compilations and live albums and backing tracks that we might not want to analyze. Let’s attack this by skipping duplicates as we go along, skipping everything after their last studio album in 1982, and handling individual track issues later.
We’d like to loop through each album, grab each track with albums/{id}/tracks, grab the track’s audio info like in the previous section, and dump it all into a dataframe. Simple enough!
data = []   # will hold all track info
albums = [] # to keep track of duplicates

# loop over albums and get all tracks
for album in d['items']:
    album_name = album['name']

    # here's a hacky way to skip over albums we've already grabbed
    trim_name = album_name.split('(')[0].strip()
    if trim_name.upper() in albums or int(album['release_date'][:4]) > 1983:
        continue
    albums.append(trim_name.upper()) # use upper() to standardize

    # this takes a few seconds so let's keep track of progress
    print(album_name)

    # pull all tracks from this album
    r = requests.get(BASE_URL + 'albums/' + album['id'] + '/tracks',
        headers=headers)
    tracks = r.json()['items']

    for track in tracks:
        # get audio features (key, liveness, danceability, ...)
        f = requests.get(BASE_URL + 'audio-features/' + track['id'],
            headers=headers)
        f = f.json()

        # combine with album info
        f.update({
            'track_name': track['name'],
            'album_name': album_name,
            'short_album_name': trim_name,
            'release_date': album['release_date'],
            'album_id': album['id']
        })

        data.append(f)
Coda (2015 Remaster)
In Through The Out Door (Remastered)
The Song Remains The Same (2018 Remaster)
Presence (Deluxe Edition)
Physical Graffiti
Houses of the Holy (2014 Remaster)
Led Zeppelin IV (Deluxe Edition; Remaster)
Led Zeppelin III (Deluxe Edition)
Led Zeppelin II (Deluxe Edition; 2014 Remaster)
Led Zeppelin (Deluxe Edition)
Okay this is the subset of albums we were hoping for. Now we just need some way to convert a list of dicts into a nice dataframe. Pandas to the rescue:
import pandas as pd

df = pd.DataFrame(data)
It’s really as easy as that. We can now do some house-cleaning tasks:
# convert release_date to an actual date, and sort by it
df['release_date'] = pd.to_datetime(df['release_date'])
df = df.sort_values(by='release_date')

# Zeppelin-specific: get rid of live album, remixes, vocal tracks, ...
df = df.query('short_album_name != "The Song Remains The Same"')
df = df[~df['track_name'].str.contains('Live|Mix|Track')]
Check out the first few rows:
df.head()
    acousticness    album_name       danceability  duration_ms energy     ...
0   0.0828  Led Zeppelin (Deluxe Edition)   0.445   166107  0.703  ...
1   0.3750  Led Zeppelin (Deluxe Edition)   0.411   402761  0.466  ...
2   0.6470  Led Zeppelin (Deluxe Edition)   0.366   388467  0.560  ...
3   0.0898  Led Zeppelin (Deluxe Edition)   0.240   388667  0.546  ...
4   0.3510  Led Zeppelin (Deluxe Edition)   0.328   274694  0.575  ...
Doing some viz
Let’s plot some of this nice data. I’m working in a Jupyter notebook, and I’m going to do a mix of seaborn and matplotlib here, so I’ll do
%matplotlib inline
import matplotlib.pyplot as plt
import seaborn as sns
Since we have all these nice Spotify-generated properties for each track, a natural idea would be to look at any patterns across the albums. Let’s start with scatter plots. We can try, say, “acousticness” against “valence” (valence is basically a measure of sad (0.0) to happy (1.0)), colored by album, and sized by length of track:
plt.figure(figsize=(10,10))

ax = sns.scatterplot(data=df, x='valence', y='acousticness',
                     hue='short_album_name', palette='rainbow',
                     size='duration_ms', sizes=(50,1000),
                     alpha=0.7)

# display legend without `size` attribute
h,labs = ax.get_legend_handles_labels()
ax.legend(h[1:10], labs[1:10], loc='best', title=None)
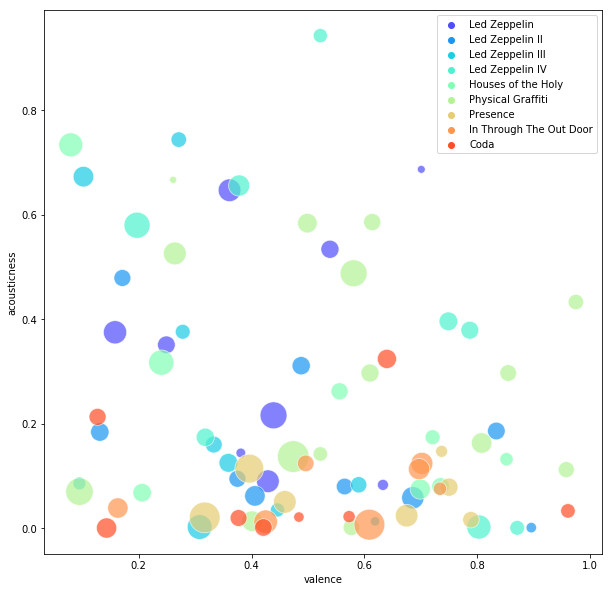
Interesting to see how much these guys shifted away from the folk-inspired acoustic tracks in later albums, how a lot of their “saddest” pieces are acoustic, and how varied they are overall — the scatter covers almost the whole 1x1 plot! Niccce. Data science: validating what you kind of already knew.
This is only capturing 1 interaction though … we could keep plotting pairs of attributes … OR, we could try to find a 2-dimensional “embedding” of the entire dataset so that if two tracks are “similar” across all dimensions, they will appear “close” in the 2-dimensional scatter.
There are many approaches to this problem of “dimensionality reduction” — for example, Principal Component Analysis (PCA) is a classic method that projects points onto a lower-dimensional hyperplane in a way that maximizes the explained variance, but it’s limited in that it is strictly linear. We could instead find/learn a nonlinear surface on which to project the points, like various “manifold learning” techniques.
Let’s do this with the popular t-SNE algorithm which comes conveniently bundled with scikit-learn. t-SNE is admittedly, a bit finicky, but it sounds exotic and we are trying to have fun here people.
from sklearn.manifold import TSNE
from sklearn.preprocessing import StandardScaler

# extract relevant columns to numpy array
X = (df
 .filter(['acousticness', 'danceability', 'duration_ms', 'energy',
          'instrumentalness', 'liveness', 'loudness', 'tempo', 'valence'])
)

# algo will do better if data is standardized (zero mean, unit variance)
Xs = StandardScaler().fit_transform(X)
We can use the standard sklearn pattern of Model().fit_transform() and plot:
# construct 2-d embedding
tsne = TSNE(n_components=2, perplexity=5,
    early_exaggeration=2, random_state=3).fit_transform(Xs)

# convert to dataframe for plotting purposes
tsne = pd.DataFrame(tsne)
tsne['short_album_name'] = df['short_album_name']
tsne['duration_ms'] = df['duration_ms']

plt.figure(figsize=(10,10))

ax = sns.scatterplot(data=tsne, x=0, y=1,
                     hue='short_album_name', palette='rainbow',
                     size='duration_ms', sizes=(50,1000),
                     alpha=0.7)

# display legend without `size` attribute
h,labs = ax.get_legend_handles_labels()
ax.legend(h[1:10], labs[1:10], loc='best', ncol=2)

plt.show()
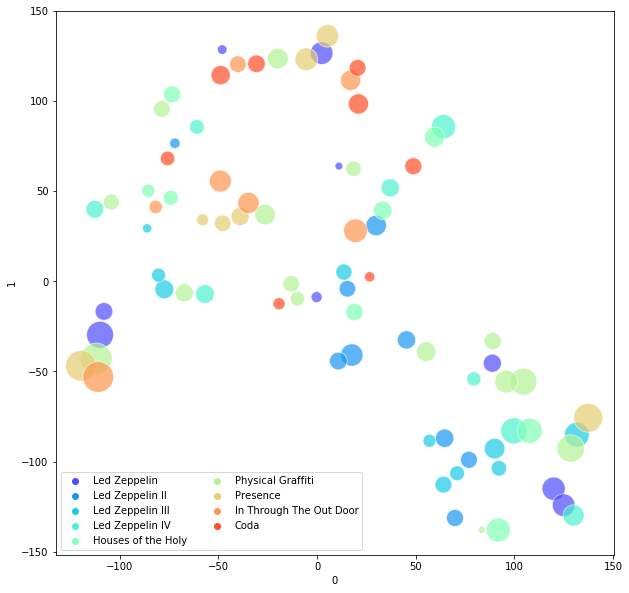
This is, admittedly, not as compelling as I’d hoped, but some patterns emerge: the bottom right is an eclectic mix of basically all their pre-Presence hits, from Stairway to Bron-y-Aur Stomp to Moby Dick. That little cluster of 5 songs on the middle left are all the hyper-epic ballads: In My Time of Dying, Achilles Last Stand, Carouselambra.
So in some sense, these songs share some fundamental high-dimensional similarity! Maybe! Or maybe we’re just reading the tea-leaves! Anyway, it’s all very fun.
Other ideas
Other fun things to investigate might be playlists (instead of single artists), profiling your own musical tastes like they do here, doing some more deliberate clustering of an artist’s discography, or going wild and investigating the structure of individual tracks with the audio-features endpoint that gives things temperature and pitches per beat of the song. For example, why use Spotify-meta-data like “danceability” when you could just cluster directly on the second-by-second timbre and rhythms of each song?
Hope this has been helpful, feedback always welcome.
Written on May 1st , 2020 by Steven Morse