Steven Morse personal website and research notes
Checking ESPN Fantasy Football Projections with Python
Written on August 5th, 2019 by Steven MorseIt’s Sunday morning, rosters are about to lock for the early afternoon slate, and you are deciding between two ninth tier WRs for that WR3 slot. It’s Week 3, they’re both waiver wire desperation picks you haven’t had time to research, and frankly, you have other fish to fry today. Behold: the ESPN Projected score for one guy is 7, for the other guy is 8. You go with the 8 and think, “that projected score has to mean something, right?”
tl;dr That projected score means essentially nothing, and we can show it, using the (undocumented) ESPN Fantasy API and a little Python.
A little background
Mike Clay is the man behind the curtain of ESPN’s fantasy projections. He swears he has a “lengthy process” that involves “statistical calculations and subjective inputs.” I mean he’s getting paid and I’m writing blog posts, so I can’t hate too much on whatever this mysterious statistical process may be.
Regardless, there are have been many analyses comparing ESPN’s projections to other sites all over the spectrum from intense reddit posts to NYT blog posts.
The consensus seems to be, ESPN’s projections aren’t very good, based on metrics like “accuracy” and R-squared which attempt to quantify overall error with a single summary statistic.
But I also notice there is very little info on how to check this for ones self. This site from footballanalytics.net links to some great R scripts but I didn’t see that any grab ESPN projections specifically (although I could be mistaken).
Exploring …
ESPN is maintaining one historical season of projections at the moment, so let’s grab 2018 and see what we find.
We’ll make use of the ESPN Fantasy API which I cover how to use here.
We are, in a nutshell, going to send ESPN the same GET request its website sends its own servers when we navigate to a historical league page. You can eavesdrop on how these requests are formed by using Safari’s Web Developer tools or a proxy service like Charles or Fiddler.
EDIT (September 2024): ESPN has changed the base URL (again) as of about April 2024, judging by this issue on cwendt’s Python package. The base URL is now:
https://lm-api-reads.fantasy.espn.com/apis/v3/games
(end edit)
Before we write code to grab all the data we need, let’s explore a little piece of it:
import requests

swid      = 'YOUR_SWID'
espn_s2   = 'LONG_ESPN_S2_KEY'
league_id = 123456
season    = 2018
week      = 5

url = 'https://fantasy.espn.com/apis/v3/games/ffl/seasons/' + \
      str(season) + '/segments/0/leagues/' + str(league_id) + \
      '?view=mMatchup&view=mMatchupScore'

r = requests.get(url,
                 params={'scoringPeriodId': week},
                 cookies={"SWID": swid, "espn_s2": espn})
d = r.json()
This is explained in a little more detail in my previous post, but the idea is we’re sending a request to ESPN’s API for a specific view on a specific league, week, and season that will give us full matchup/boxscore info including projected points. The cookies are only needed for private leagues, and again, I cover it here.
If you navigate through the JSON structure, you will find that each fantasy team has a roster of its players, and each player has a listing of its stats.
(Again, a nice way to navigate around this structure is with Safari’s Web Developer tools: go to a page of interest in your fantasy league’s clubhouse, open Web Developer tools, go to Resources, then look under XHRs for an object with your league ID. This will be the raw text of the JSON … change “Response” to “JSON” in the little header area for a more user-friendly explorer-style interface.)
Grabbing all 2018 Projections
It’s a little hidden, but within this sub-structure is the projected and actual fantasy points for each player on each roster.
I noticed that the stats list for a particular player has 5-6 entries, one of which is always the projected score and another is the actual. The projected score is identified by statSourceId=1, the actual with statSourceId=0.
Let’s use this observation to build a set of loops to send GET requests for each week, then extract each projected/actual score for each player on each roster.
import requests
import pandas as pd

league_id = 123456
season    = 2018

slotcodes = {
    0 : 'QB', 2 : 'RB', 4 : 'WR',
    6 : 'TE', 16: 'Def', 17: 'K',
    20: 'Bench', 21: 'IR', 23: 'Flex'
}

url = 'https://fantasy.espn.com/apis/v3/games/ffl/seasons/' + \
      str(season) + '/segments/0/leagues/' + str(league_id) + \
      '?view=mMatchup&view=mMatchupScore'

data = []
print('Week ', end='')
for week in range(1, 17):
    print(week, end=' ')

    r = requests.get(url,
                     params={'scoringPeriodId': week},
                     cookies={"SWID": swid, "espn_s2": espn})
    d = r.json()

    for tm in d['teams']:
        tmid = tm['id']
        for p in tm['roster']['entries']:
            name = p['playerPoolEntry']['player']['fullName']
            slot = p['lineupSlotId']
            pos  = slotcodes[slot]

            # injured status (need try/exc bc of D/ST)
            inj = 'NA'
            try:
                inj = p['playerPoolEntry']['player']['injuryStatus']
            except:
                pass

            # projected/actual points
            proj, act = None, None
            for stat in p['playerPoolEntry']['player']['stats']:
                if stat['scoringPeriodId'] != week:
                    continue
                if stat['statSourceId'] == 0:
                    act = stat['appliedTotal']
                elif stat['statSourceId'] == 1:
                    proj = stat['appliedTotal']

            data.append([
                week, tmid, name, slot, pos, inj, proj, act
            ])
print('\nComplete.')

data = pd.DataFrame(data,
                    columns=['Week', 'Team', 'Player', 'Slot',
                             'Pos', 'Status', 'Proj', 'Actual'])
Week 1 2 3 4 5 6 7 8 9 10 11 12 13 14 15 16
Complete.
We get something like this:
data.head()
    Week    Team    Player  Slot    Pos Status  Proj    Actual
0   1   1   Leonard Fournette   2   RB  QUESTIONABLE    13.891825   5.0
1   1   1   Christian McCaffrey 2   RB  ACTIVE  11.067053   7.0
2   1   1   Derrick Henry       20  Bench   ACTIVE  10.271163   2.0
3   1   1   Josh Gordon         4   WR  OUT 6.153141    7.0
4   1   1   Philip Rivers       0   QB  QUESTIONABLE    26.212294   42.0
Yes, yes, this is only players on rosters, so we’re not capturing any free agents … but it should at least give us a sense of the accuracy of ESPN’s projections, for now.
Let’s plot “Proj” against “Actual” for a few different positions and cross our fingers …
fig, axs = plt.subplots(1,3, sharey=True, figsize=(12, 4))

for i, pos in enumerate(['QB', 'RB', 'WR']):
    (data
     .query('Pos == @pos')
     .pipe((axs[i].scatter, 'data'),
           x='Proj', y='Actual',
           s=50, c='b', alpha=0.5)
    )
    axs[i].plot([0,50], [0,50], 'k--')
    axs[i].set(xlim=[0,50], ylim=[0,50],
               xlabel='Projected',
               title=pos)
axs[0].set_ylabel('Actual')

plt.tight_layout()
plt.show()
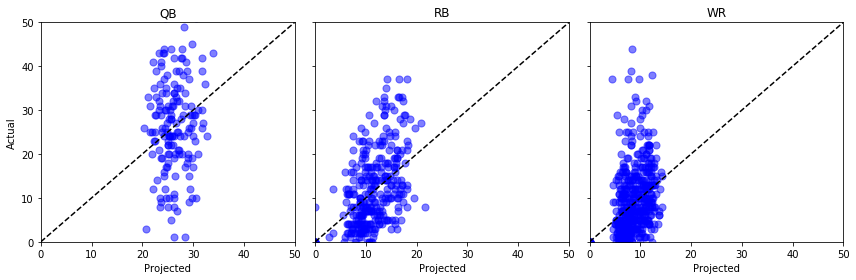
Um, not great. We could do some statistical tests here but to my untrained eye it looks like those projected points might as well be coming out of a uniform distribution.
Maybe it’s better on certain weeks? Later in the season, maybe? Let’s plot the overall error, by week, by position. This code gets a little hacky :( but I’m prepared to live with it:
fig, axs = plt.subplots(1,3, sharey=True, figsize=(13,4))

data['Error'] = data['Actual'] - data['Proj']
data['Cat'] = pd.cut(data['Week'], bins=4, labels=[0,1,2,3])

cols = sns.color_palette('Blues')

# dummy plots for a legend
for k,cat in enumerate(['1-4', '5-9', '10-13', '14-17']):
    axs[0].plot([],[], c=cols[k], label='Wk ' + cat)
axs[0].legend()

for i, pos in enumerate(['QB', 'RB', 'WR']):
    for cat in range(4):
        t = data.query('Pos == @pos & Cat == @cat')
        sns.kdeplot(t['Error'], color=cols[cat],
                    ax=axs[i], legend=False)
    axs[i].set(xlabel='Actual - Proj', title=pos)

plt.show()
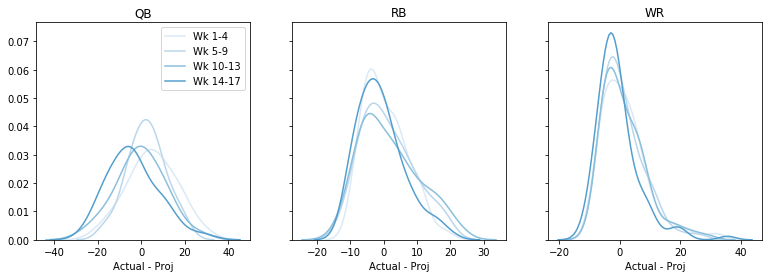
Maybe there is a tendency to overproject later in the season, but overall I’d say nothing here either. (Note by doing this we lost some information about whether the error is more or less for high vs. low projections.)
Next steps
I’d like to look at the time series of players’ points next. The common sense wisdom is that the best way to guess what a player will score next week is to just eyeball his last 4-5 weeks … how reliable of a strategy is this?
In this post, I try checking ESPN projections at a roster level — maybe the individual projections aren’t impressive, but in aggregate do they magically begin to help? (Spoiler: not really.)
Written on August 5th, 2019 by Steven Morse