Steven Morse personal website and research notes
Scraping Pro Football Reference with Python
Written on August 13th, 2019 by Steven MorsePro Football Reference is a stat-head’s dream — there is a wealth of football information, it is easily accessible directly on the site through built-in APIs, and it is cleanly formatted which makes data scraping a non-headache-inducing endeavor.
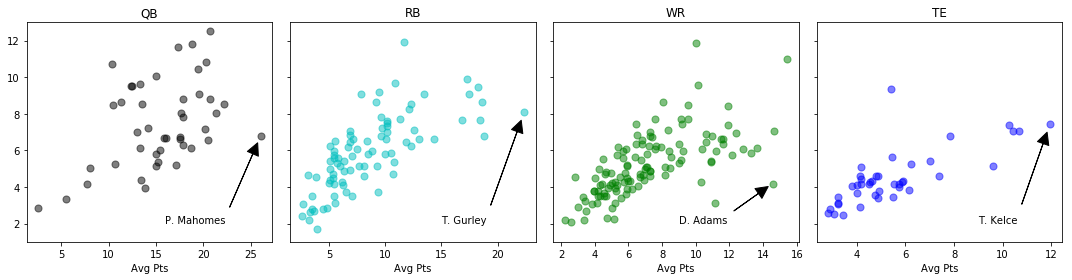
This post outlines how to grab historical fantasy points for individual players using Python. (Here’s an older, shorter post using R.) We’ll be able to do plots like this, which groups similar players based on their point average and variance.
Scraping a single table
The hard way to scrape a table is manually grabbing the raw HTML with requests, then manually parsing the table structure with BeautifulSoup. But if we don’t need much fine control, there’s a better way.
The easy way to scrape a table is using pandas.read_html. Here’s what it looks like to scrape Russell Wilson’s fantasy data from 2018 with 3 lines of code:
import pandas
url = 'https://www.pro-football-reference.com/players/W/WilsRu00/fantasy/2018/'
df = pd.read_html(url)[0]
    Unnamed: 0_level_0  Inside 20   Inside 10   Snap Counts Unnamed: 4_level_0
    Unnamed: 0_level_1  Passing Rushing Passing Rushing ...
    Rk  G#  Date    Tm  Unnamed: 4_level_2  ...
0   1.0 1.0 2018-09-09  SEA @ ...
1   2.0 2.0 2018-09-17  SEA @ ...
That’s it folks! read_html returns a list of all the <table>’s on the page, in pandas.DataFrame form, and since we peeked at the page we know to just grab the first one and we’re off and running!
Obviously we have some seriously ugly column headers to deal with, but we can get to that later.
Scraping multiple pages
If we want to automate scraping multiple pages, though, we need to get a little more detailed. Now we’ll bring in the aforementioned requests, which is a base Python package that allows us to do lower-level HTML/XML requests, and BeautifulSoup, which is a package for manipulating and crawling raw HTML/XML.
(By the way, scraping webpages is an important tool in ethical (white-hat) hacking — here is a nice set of online courses in this skill that also introduce basic Python skills along the way.)
Notice that PFR’s naming scheme for players is a little odd. Russell Wilson’s stub is W/WilsRu00 but Antonio Brown’s is B/BrowAn04. How are we going to figure out what all these are and then loop through each page?
Check out the Fantasy Leaders page. This is a list of every active player in the season along with their season fantasy stats, ordered by overall fantasy points. Notice that each player in this table is hyperlinked to their individual page. Wouldn’t it be nice if we could crawl through this table and record each player’s URL stub? We can’t do this with our pandas.read_html trick anymore, because that strips the hyperlinks to the caption text. (That is, of <a href="url">Player</a> it only grabs Player.)
But we can do it: let’s use requests to grab the raw HTML, then BeautifulSoup to crawl through the Name column of the table, recording things like the hyperlink as we go.
Here’s how to grab the first table as a BeautifulSoup object:
from bs4 import BeautifulSoup

url = 'https://www.pro-football-reference.com'
year = 2018

r = requests.get(url + '/years/' + str(year) + '/fantasy.htm')
soup = BeautifulSoup(r.content, 'html.parser')
parsed_table = soup.find_all('table')[0]
The r = requests.get(...) line grabs the webpage, and we give the raw HTML r.content to BeautifulSoup and make the object soup. We can then do things like find_all instances of the 'table' tag, and grab the first one with [0].
Now that we have the raw HTML of the table stored in parsed_table, here’s how to loop through the rows of the table, grabbing the player name entry (which you may notice from trawling the page source is conveniently labeled with the attribute data-stat="player") and extracting the parts of the <a> tag that we want:
# first 2 rows are col headers so skip them with [2:]
for i,row in enumerate(parsed_table.find_all('tr')[2:]):
    dat = row.find('td', attrs={'data-stat': 'player'})
    name = dat.a.get_text()
    stub = dat.a.get('href')

    # NEXT: use `stub` to access the player page
This stub contains the nugget of information we came for. We’re now ready to combine our code so far into one enormous, glorious loop:
url = 'https://www.pro-football-reference.com'
year = 2018
maxp = 300

# grab fantasy players
r = requests.get(url + '/years/' + str(year) + '/fantasy.htm')
soup = BeautifulSoup(r.content, 'html.parser')
parsed_table = soup.find_all('table')[0]

df = []

# first 2 rows are col headers
for i,row in enumerate(parsed_table.find_all('tr')[2:]):
    if i % 10 == 0: print(i, end=' ')
    if i >= maxp:
        print('\nComplete.')
        break

    try:
        dat = row.find('td', attrs={'data-stat': 'player'})
        name = dat.a.get_text()
        stub = dat.a.get('href')
        stub = stub[:-4] + '/fantasy/' + str(year)
        pos = row.find('td', attrs={'data-stat': 'fantasy_pos'}).get_text()

        # grab this players stats
        tdf = pd.read_html(url + stub)[0]

        # get rid of MultiIndex, just keep last row
        tdf.columns = tdf.columns.get_level_values(-1)

        # fix the away/home column
        tdf = tdf.rename(columns={'Unnamed: 4_level_2': 'Away'})
        tdf['Away'] = [1 if r=='@' else 0 for r in tdf['Away']]

        # drop all intermediate stats
        tdf = tdf.iloc[:,[1,2,3,4,5,-3]]

        # drop "Total" row
        tdf = tdf.query('Date != "Total"')

        # add other info
        tdf['Name'] = name
        tdf['Position'] = pos
        tdf['Season'] = year

        df.append(tdf)
    except:
        pass

df = pd.concat(df)
df.head()
G#  Date    Tm  Away    Opp FantPt  Name    Position    Season
0   1.0 2018-09-10  LAR 1   OAK 20.7    Todd Gurley RB  2018
1   2.0 2018-09-16  LAR 0   ARI 29.3    Todd Gurley RB  2018
2   3.0 2018-09-23  LAR 0   LAC 19.6    Todd Gurley RB  2018
3   4.0 2018-09-27  LAR 0   MIN 21.6    Todd Gurley RB  2018
4   5.0 2018-10-07  LAR 1   SEA 29.3    Todd Gurley RB  2018
and since this will probably take a few minutes (depending on your maxp setting and your internet connection), I recommending saving the df to a CSV:
df.to_csv('fantasy2018.csv')
Plotting average vs. variance
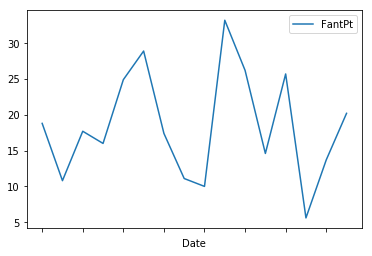
So now you can easily grab one or more players’ fantasy point performance trajectories over the season and plot them if you so desire:
(df.query('Name == "Saquon Barkley"')
    .plot('Date', 'FantPt'))
To get a feel for more of the data, let’s look at some summary statistics. My first thought is to reduce the trajectory of each player’s fantasy performance to a mean and a variance. The ideal player has a high mean/average point total, and doesn’t deviate too far away from it. A boom-or-bust player has, perhaps, a moderate to high mean but an extremely high variance.
Here’s the (brute force) code:
fig, ax = plt.subplots(1,4, sharey=True, figsize=(15,4))

cols = ['k', 'c', 'g', 'b']

for i, pos in enumerate(["QB", "RB", "WR", "TE"]):
    t = (df
     .query('Position == @pos')
     .groupby('Name')
     .agg({'FantPt': ['mean', 'std'],
           'Position': 'min'}))
    ax[i].scatter(t[('FantPt','mean')], t[('FantPt', 'std')],
                  c=cols[i], s=50, alpha=0.5, label=pos)
    ax[i].set(xlabel='Avg Pts', title=pos)

# label some outliers
ax[0].annotate('P. Mahomes', xy=(26, 6.76), xytext=(16, 2),
                arrowprops={'facecolor':'black', 'width':0.1, 'shrink':0.08})
ax[1].annotate('T. Gurley', xy=(22.36, 8.1), xytext=(15, 2),
                arrowprops={'facecolor':'black', 'width':0.1, 'shrink':0.08})
ax[2].annotate('D. Adams', xy=(14.57, 4.2), xytext=(9, 2),
                arrowprops={'facecolor':'black', 'width':0.1, 'shrink':0.1})
ax[3].annotate('T. Kelce', xy=(11.97, 7.5), xytext=(9, 2),
                arrowprops={'facecolor':'black', 'width':0.1, 'shrink':0.1})

ax[0].set(ylim=[1,13])
plt.tight_layout()

plt.show()
And the plot is the one at the beginning of the blog.
What’s next
It’s a bit silly to pull all this data just to compress it to two summary statistics, but this is a short post. It may be interesting to group similar players based on the dynamics of their entire time series, although this may not be very meaningful or predictive.
All that aside, hopefully this post gives you some basic tools to do simple web scraping in Python.
Written on August 13th, 2019 by Steven Morse