Steven Morse personal website and research notes
Boxscores with ESPN Fantasy Football (in Python) - Part 2
Written on August 1st , 2018 by Steven MorseEDIT: ESPN changed their Fantasy API to v3 in early 2019, so lots of v2 code from this post no longer works. Don’t worry we’re on it:
- Here’s an intro to using the new version.
- Here’s how to grab historical projections using the new version.
Check it out.
This is the first of two follow-on posts to this post about using ESPN’s Fantasy API. tl;dr This post shows how to get detailed historical boxscores (including active + bench player stats) thru the (hidden) ESPN Fantasy Football API, the second one will show how to access private league info such as by-player stats including free agents.
The boxscore endpoint
An ESPN fantasy boxscore for a particular matchup includes all player stats for all starter and bench players, on both fantasy teams. It also includes which stats were actually scored, the effective totals, and various info about the player and fantasy team. We can access this info through the ESPN Fantasy API and a simple GET request, no web-scraping required.
Read this previous post to get up-to-speed on the setup here.
First import the necessary packages.
%matplotlib inline
import matplotlib.pyplot as plt
import requests
import numpy as np
import pandas as pd
Here’s the trick: you need to do a separate GET request for each scoring period (with matchupPeriodId) and each fantasy team (teamId). (If you don’t specify the team, you get nothing, and if you don’t specify a scoring period, it defaults to the current/last week.) This single request will give the boxscore for an entire matchup, both teams.
Oddly enough this appears to work without session cookies, so long as the league is public, but if you have a private league, see the next section.
Regardless, let’s loop through each week, and each matchup, with a request to boxscore each time, and save the results. We have to make an unfortunate call to scoreboard each week to find out who matched up with who to do the right teamId calls.
Here’s code to do just that, and save the results in a big dict that we can pickle for later.
leagueId, seasonId = 123456, 2017

sbs = {}
bss = {}

print('Week', end=' ')
for week in range(1,17):
    print(week, end=' .. ')

    sb = requests.get('http://games.espn.com/ffl/api/v2/scoreboard',
                     params={'leagueId': leagueId, 'seasonId': seasonId, 'matchupPeriodId': week})
    sb = sb.json()
    sbs[week] = sb
    bss[week] = {}

    # loop through matchups that week
    for match in range(len(sb['scoreboard']['matchups'])):
        homeId = sb['scoreboard']['matchups'][match]['teams'][0]['team']['teamId']

        r = requests.get('http://games.espn.com/ffl/api/v2/boxscore',
                         params={'leagueId': leagueId, 'seasonId': seasonId,
                                 'teamId': homeId, 'matchupPeriodId': week},
                         #cookies={'SWID': swid, 'espn_s2': espn}
                        )
        r = r.json()
        bss[week][match] = r

print('\nSaving to pickle..')
pickle.dump(sbs, open('homie_2017_sbs.pkl', 'wb'))
pickle.dump(bss, open('homie_2017_bss.pkl', 'wb'))
print('Complete.')
It’s worth poking around the boxscore JSON yourself — there is a ton of info in there. Here’s an example of the info for a single player, for a single matchup:
{'currentPeriodProjectedStats': {},
 'currentPeriodRealStats': {'appliedStatTotal': 15,
  'appliedStats': {'20': -2, '28': 4, '4': 6, '7': 7},
  'rawStats': {'0': 32, ... }},
 'isQueuedWaiverLocked': False,
 'isTradeLocked': False,
 'lockStatus': 4,
 'opponentProTeamId': 27,
 'player': {'defaultPositionId': 1,
  'draftRank': 75.5,
  'eligibleSlotCategoryIds': [0, 20],
  'firstName': 'Cam',
  'healthStatus': 2,
  'isActive': True,
  'isIREligible': False,
  'jersey': '1',
  'lastName': 'Newton', ... },
 'proGameIds': [371029027],
 'pvoRank': 20,
 'slotCategoryId': 0,
 'watchList': False}
Let’s pluck out some basic stats per player, per week, and record whose fantasy team they were playing for.
# slot codes
slots = {0: 'QB', 2: 'RB', 4: 'WR', 6: 'TE',
         16: 'D/ST', 17: 'K', 20: 'BE', 23: 'FLEX'}

# rows will be by player by week
df = pd.DataFrame(columns=['playerName', 'matchupPeriodId',
                           'slotId', 'position', 'bye', 'appliedStatTotal',
                           'teamAbbrev', 'wonMatchup'])

for week in range(1,17):
    for match in range(len(sbs[week]['scoreboard']['matchups'])):
        homeId = sbs[week]['scoreboard']['matchups'][match]['teams'][0]['team']['teamId']
        winner = sbs[week]['scoreboard']['matchups'][match]['winner']

        # loop through home (0) and away (1)
        for team in range(2):
            # boolean for who won this matchup
            winb = False
            if (winner=='away' and team==1) or (winner=='home' and team==0):
                winb = True

            # fantasy team info (dict)
            tinfo = bss[week][match]['boxscore']['teams'][team]['team']

            # all players on that team info (array of dicts)
            ps = bss[week][match]['boxscore']['teams'][team]['slots']

            # loop through players
            for k,p in enumerate(ps):
                # players on bye/injured won't have this entry
                try:
                    pts = p['currentPeriodRealStats']['appliedStatTotal']
                except KeyError:
                    pts = 0

                # there is some messiness in the json so just skip
                try:
                    # get player's position. this is a bit hacky...
                    pos = p['player']['eligibleSlotCategoryIds']
                    for s in [20, 23]:
                        if pos.count(s) > 0:
                            pos.remove(s)
                    pos = slots[pos[0]]

                    # add it all to the DataFrame
                    df = df.append({'playerName': p['player']['firstName'] + ' ' + p['player']['lastName'],
                                    'matchupPeriodId': week,
                                    'slotId': p['slotCategoryId'],
                                    'position': pos,
                                    'bye': True if p['opponentProTeamId']==-1 else False,
                                    'appliedStatTotal': pts,
                                    'teamAbbrev': tinfo['teamAbbrev'],
                                    'wonMatchup': winb},
                                   ignore_index=True)
                except KeyError:
                    continue
There’s some jankiness in that code but it gets the job done. Let’s look at it:
	playerName			matchupPeriodId	slotId	position	bye	appliedStatTotal	teamAbbrev	wonMatchup
0	Ben Roethlisberger	1.0				0.0		QB			False		23.0	XYZ	False
1	Mark Ingram			1.0				2.0		RB			False		6.0		XYZ	False
2	Tevin Coleman		1.0				2.0		RB			False		5.0		XYZ	False
3	Odell Beckham Jr.	1.0				4.0		WR			False		0.0		XYZ	False
4	Michael Crabtree	1.0				4.0		WR			False		8.0		XYZ	False
Doing some viz
We can now definitively answer many burning questions.
Let’s tackle: who was the worst team manager? I.e., who consistently “left points on the bench”? One way to measure that is by looking at average score of starters vs. bench. If you consistently average higher on your bench than your starters, you’re starting the wrong people. One problem with this approach is that an average is going to obscure information (e.g. you have two strong QBs, because you’re dangling one as a trade opportunity, and even though you managed your bench well, the QB is driving up the average).
Hypothesis! I would guess we’ll see teams’ losses correlated with their bench averaging higher than their starters.
First wrangle the data we need into a nice form with some pandas jiu-jitsu, team names anonymized to protect the innocent :)
bex = (df.assign(BE = df['slotId']==20)
        .pivot_table(index=['teamAbbrev', 'matchupPeriodId'],
                     columns='BE',
                     values='appliedStatTotal',
                     aggfunc=np.mean)
        .reset_index()
        .rename(columns={'teamAbbrev': 'Team',
                         'matchupPeriodId': 'Matchup',
                         False:'Avg active',
                         True:'Avg bench'}))
bex['Won'] = (df.groupby(['teamAbbrev', 'matchupPeriodId'])
				.agg({'wonMatchup': 'min'})
				.reset_index(drop=True))
bex.head()
	Team	Matchup	Avg active	Avg bench	Won
0	E 		1.0		14.200000	3.8			True
1	E		2.0		11.200000	4.0			True
2	E		3.0		10.454545	12.8		False
3	E		4.0		10.727273	1.6			True
4	E		5.0		11.545455	1.8			True
… and then plot it (just showing 4 teams for visual clarity) …
fig, ax = plt.subplots(1,1, figsize=(8,8))

teams = list('ABCD')
tbex = bex[(bex['Team'].isin(teams))]

pal = ['k', 'lightsteelblue', 'chartreuse', 'sandybrown']
for i,t in enumerate(teams):
    for w, m in [(True, 'o'), (False, 'X')]:
        ax.scatter(tbex[(tbex['Won']==w) & (tbex['Team']==t)]['Avg active'],
                   tbex[(tbex['Won']==w) & (tbex['Team']==t)]['Avg bench'],
                   c=pal[i], s=150, marker=m,
                   alpha=0.9,
                   label=t if w else None)

ax.plot([0,17], [0,17], 'k--')
ax.set(xlim=[0,17], ylim=[0,17],
       xlabel='Avg starter', ylabel='Avg bench')
ax.legend(title='Team')
plt.show()
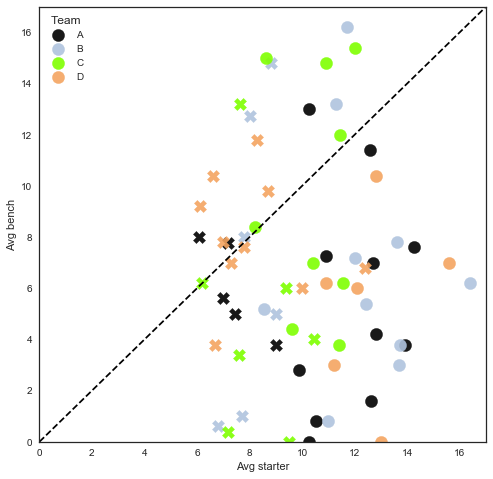
Narrative here: hypothesis is … kinda wrong! The line between winning and losing is mostly just a vertical one, doesn’t really matter if your bench was averaging more than your starters, so long as you score enough points with your starters. In hindsight maybe that’s obvious.
By the way, I resorted to matplotlib here. If there’s a slick way to do this with seaborn or pandas.DataFrame.plot, I doubt it (because of the multiple markers), but let me know.
Sidenote: I find myself “resorting” to matplotlib a lot. Using seaborn, or pandas.plot, or even ggplot2 in R, always feels like trying to line up a bunch of bottles in a perfect line so you can shoot them with one bullet. Whereas matplotlib feels like walking over and smashing each bottle with a hammer. It’s just so much quicker (usually) and, I’ll say it, more satisfying.
EDIT: Mea culpa. Seaborn has a scatterplot method that accepts a categorical column for markers (and marker sizes). Learn something new every day… see this post.
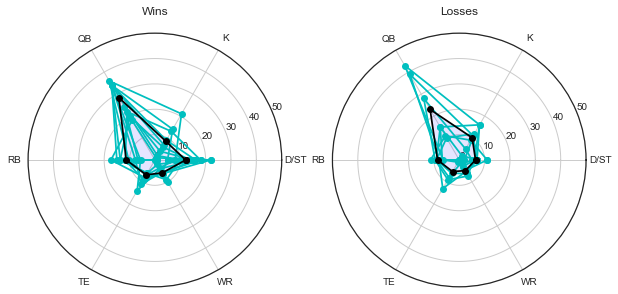
Let’s do one more. I want to know if there’s a “winner profile” — if win a fantasy team wins, it’s always because of the QB, or because of strong RB/WR coupling, etc. To do this, I’m going to employ the love-it-or-hate-it radar plot (I don’t love or hate it. It’s fine. I believe the criticism is that the enclosed visual area doesn’t change in proportion to the changes in the vector being represented.).
First we’ll aggregate and wrangle the necessary statistics.
z = (df[(df['slotId'] != 20)]
 .filter(items=['teamAbbrev', 'matchupPeriodId', 'position', 'appliedStatTotal', 'wonMatchup'], axis=1)
 .groupby(['teamAbbrev', 'matchupPeriodId', 'position'])
 .agg({'appliedStatTotal': 'mean'})
 .unstack('position')
 .reset_index())
z['Won'] = df.groupby(['teamAbbrev', 'matchupPeriodId']).agg({'wonMatchup': 'min'}).reset_index(drop=True)
z.columns = ['Team', 'Matchup', 'D/ST', 'K', 'QB', 'RB', 'TE', 'WR', 'Won']
z.head()
	Team	Matchup	D/ST	K	    QB	  RB	      TE	  WR	      Won
0	AJ	   1.0	  22.0	14.0	23.0	11.666667	4.0   14.666667	True
1	AJ	   2.0	  15.0	8.0	  27.0	13.333333	4.0   6.000000	True
2	AJ	   3.0	  -6.0	11.0	35.0	18.000000	1.0	  5.000000	False
3	AJ	   4.0	  10.0	9.0	  32.0	8.333333	11.0	7.750000	True
4	AJ	   5.0	  14.0	10.0	32.0	22.500000	3.0	  4.600000	True
And the plot … (again with the matplotlib)
fig, axs = plt.subplots(1,2, figsize=(10,5), subplot_kw={'polar': True})
thetas = [i * np.pi / 3 for i in range(7)]
cols = ['D/ST', 'K', 'QB', 'RB', 'TE', 'WR']
zt = z[z['Team']=='A']

for i, w in enumerate([True, False]):
    for match in zt['Matchup'].unique():
        zmx = zt[(zt['Matchup']==match) & (zt['Won']==w)][cols].as_matrix()
        if zmx.shape[0] == 0: continue
        zmx = np.append(zmx[0], zmx[0,0])
        axs[i].plot(thetas, zmx, 'co-')
        #axs[0].fill(thetas, zmx, 'b', alpha=0.1)

    zmx = zt[zt['Won']==w][cols].mean().as_matrix()
    zmx = np.append(zmx, zmx[0])
    axs[i].plot(thetas, zmx, 'ko-')
    axs[i].fill(thetas, zmx, 'b', alpha=0.1)
    axs[i].set(xticks=thetas[:-1],
               xticklabels=cols,
               yticks=[0,10,20,30,40,50],
               title='Wins' if w else 'Losses')

plt.show()
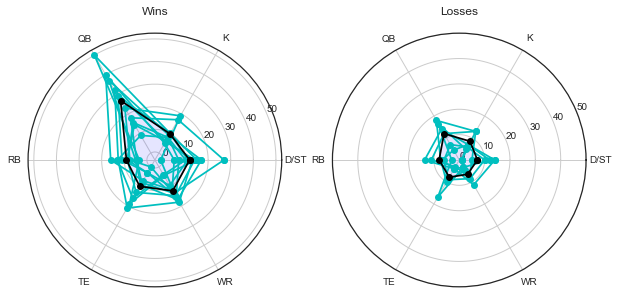
This team is getting almost all the variation between “win” and “lose” just in QB performance. (This was my team, and the QB was Russell Wilson. I entered the playoffs with the highest standing in the league but lost in the semifinals.) Contrast that with the radar plot at the beginning of the blog, different team, with a lot of variation from all players.
In the next post, I’ll cover how to do all this if you’re in a private league, and how that also allows you to pull other ESPN login-wall-blocked stats, such as free agent info.
Written on August 1st , 2018 by Steven Morse